Research related:
Other other:
Things to keep in mind:
“If we subscribe to the idea of “contraction and convergence,” which means that all countries aim eventually to have equal per-capita emissions, then Britain needs to aim for cuts greater than 85%: it should get down from its current 11 tons of CO2 equivalents per year per person to roughly 1 ton per year per person by 2050.” Mackay (2009)
Here are some numbers to compare this target of “roughly 1 ton per year per person” with:
| Territorial | Consumption-based | |
|---|---|---|
| Belgium | 7 | 17 |
| Netherlands | 6 | 8 |
| France | 4 | 6 |
| US | 14 | 16 |
| China | 9 | 8 |
| India | 2 | 2 |
| Indonesia | 3 | 3 |
| Ethiopia | <1 | <1 |
When accounting for the CO2 associated with imported goods, Belgians are probably worse than Americans! Note, this is CO2, not CO2 equivalents. Actual greenhouse gas emissions are even more terrifying.
| Destination | CO2eq ton per capita |
|---|---|
| Vienna | 0.7 |
| Barcelona | 0.8 |
| Oslo | 0.8 |
| Istanbul | 0.9 |
| Casablanca | 1.0 |
| Cairo | 1.4 |
| Addis Ababa | 2.1 |
| New York | 2.2 |
| Johannesburg | 3.3 |
| Mexico city | 3.4 |
| Bangkok | 3.4 |
| Rio de Janeiro | 3.4 |
| Santiago | 4.4 |
| Melbourne | 6.1 |
| Auckland | 6.8 |
Clearly, air travel is incompatible with social justice.
A typical passenger vehicle emits roughly 0.25 ton CO2 per 1000 km see here. Commuting to work like my (and many of my peers’) parents used to do likely amounts to more than 2 tons CO2 per year.
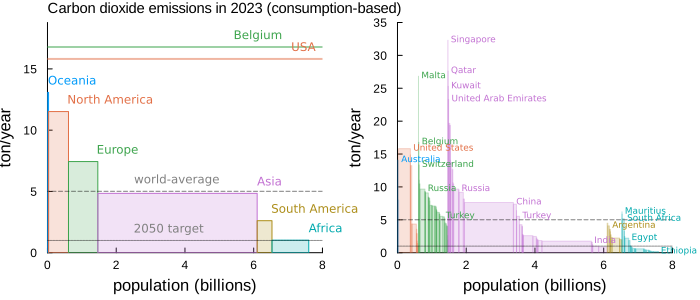
Here’s a graph I made based on the data for 2023 available at “our world in data”. This is an update of the graphs of Mackay in his important 2009 book on energy. I’m showing the consumption-based emission estimates. The width of each rectangle shows the population size, whereas the height shows the per-capita emission estimate, so that the area shows the total emission estimate for each continent (left) and country (right, with colors per continent as in the left graph). The black dashed line shows the world-average per-capita emissions. On the right, I’m highlighting the estimates for Belgium and the US with a horizontal line.
It should be stressed that this includes (estimates of) all emissions from industry, households, transport etc., the ‘responsibility’ for which, in this sort of graph, is visualized as equally spread across a continent/country’s population.
Of course, not everyone ‘benefits’ to the same extent from emissions associated with large-scale infrastructure, polluting industries, agriculture, and all sorts of things that are ultimately regulated by some governmental policy, so this picture hides a lot about who should be held accountable before anyone else. Nevertheless, let us assume this ‘equal sharing’ of responsibility for the emissions associated with ‘our prosperity’ (‘onze welvaart’ as they say) is just and reasonable (it isn’t), and have a look at what is beyond any doubt a private luxury decision i.e.~to make an intercontinental flight for leisure.
Compare once more the graphs with the flight emissions above, and with the (probably optimistic) roughly 1 ton/per year/per person by 2050. It is clear that no amount of “governments have to take climate action seriously” or “it’s those damn large companies!” (“individuele actie is zinloos, het beleid moet veranderen! De grote vervuilers moeten aangepakt worden!” etc. etc.) will absolve anyone from the responsibility of not traveling by plane out of boredom. Setting holiday air travel aside for a minute, and assuming governments do manage to reduce all other emissions drastically to say 1ton/pp/year, anyone’s choice to fly to the other side of the world would instantly make them emit at least three to four times the (desired) national average. To demand that governments (“het beleid”) compensate (“offset”) this seems rather extravagant, if we pause a second to consider actual societal issues.
“Yes, but look at all those people that don’t even have solar panels, and use gas for domestic heating and commute to their work with diesel cars, etc.!” Living more sustainable with (low/high-)technological fixes (usually) requires – besides a good will – money, time, effort and research. Living more sustainable by not doing something that is at any rate unnecessary (e.g. not flying for holidays) clearly does not require time, money, effort or research, just a good will.
“But tourism supports local economies!” Send your money by mail, they won’t miss you.
“But it is all screwed up anyhow!” Easy to proclaim, but not quite transparent as to what sort of moral philosophy is implied. Whether the plausibility of it all ‘being screwed up’ implies one should not take individual action (or, in this case, inaction), I cannot decide for anyone else. I, in any case, don’t believe it does.
“I’ll only live once, and I want to see the world!” Who knows? and if so, you only get one chance to do it right, so make sure you’re sure of what is ‘right’.
Some things on the internet I often find myself recommending:

alle rechten voorbehouden (AZ 2025) – whatever that means.